Blog ▸ Forecasting GPU Spend When the Workload Is Still Changing
GPU Infrastructure
The median bill ran 2.8 times the engineering forecast across 84 measured deployments. Forecasts miss in one direction because three inputs move the same way.
Forecasting GPU Spend When the Workload Is Still Changing
GPUaaS.com Team
GPU Infrastructure
September 22, 2026
No items found.
Across 84 anonymised production deployments measured between Q4 2025 and Q1 2026, the median bill ran 2.8 times the engineering forecast within the first 60 days.
Only 15% of organisations forecast AI costs within 10% of actual. The other 85% miss by more, and they miss in one direction.
Key takeaways
Median bill ran 2.8x the engineering forecast across 84 measured production deployments in the first 60 days
46.9% of organisations came in above plan against 5.6% below. That asymmetry means the inputs are wrong in a consistent direction
Three inputs moved in 2026: token price fell 50-94%, RAG context grew 4K to 50K+, and agentic volume ran 2-3x forecast
Budget approval is annual. AI spend grows monthly. Uber exhausted its 2026 AI coding budget by April
Configuration changes cut one measured deployment 59%, so a forecast assuming current config is forecasting a choice
◆ THE ASYMMETRY IS THE USEFUL PART
An eight-to-one split is not imprecision
That asymmetry is the useful part. Among 1,636 IT decision makers surveyed in the second half of 2026, 46.9% reported AI spend above plan and 5.6% below. Roughly 35.6% were moderately above and 11.3% substantially above, while 31.8% landed in line and 10% had no formal budget to measure against.
A forecast that was merely imprecise would scatter both ways. An eight-to-one split above plan means the inputs are wrong in a consistent direction, and three inputs move the same way.
◆ WHAT MOVED INSIDE THE FORECAST PERIOD
Input
Change during 2026
Direction of effect
Price per token
Down 50-94%
Lowers cost, offset by volume
Context length
4K to 50K+ tokens
Raises cost on every request
Requests per action
2-3x where agents are used
Raises cost
Hidden charges
18-34% overhead
Never in the original forecast
◆ THREE INPUTS THAT MOVED
Right when built, wrong six weeks later
Per-token costs on major models dropped 50 to 94% year over year by July 2026, while volume rose faster than the saving. A team that forecast unit cost correctly still blew the budget, because the price deck changed underneath a volume assumption that changed more.
RAG context windows went from 4K tokens to 50K and beyond inside a single forecast period. That is a twelvefold change in a multiplier nobody re-ran, applied to every request. The cost mechanics of that growth are covered in what 128K windows do to your bill.
Where agents were involved, measured token volume ran two to three times higher than forecast. One user action becomes a plan, several tool calls, a critique and a revision.
None of those are forecasting errors in the ordinary sense. The model was right when it was built and wrong six weeks later.
2.8x
the median bill against engineering forecast across 84 anonymised production deployments, measured in the first 60 days of operation
OpsLyft AI infrastructure benchmark, Q4 2025 to Q1 2026
◆ TIMING AND VISIBILITY COMPOUND
Annual approval against monthly growth
Timing makes it worse. Budget approval happens once a year. AI spend grows monthly, and the gap between those two cadences is where overruns accumulate unnoticed. Uber exhausted its entire 2026 AI coding budget by April, four months into a twelve-month plan.
The visibility problem compounds the timing one. Organisations budget 30 to 36% of cloud spend for AI, while AI-specific line items appear at about 2.5% of bills. Reported AI spending runs roughly twelve times lower than actual AI-driven cloud consumption.
AI consumption appears inside bills that were never labelled AI, from SaaS features, vector stores, direct provider keys and coding agents that nobody added to a budget line.
◆ WHERE THE 2.8x COMES FROM
Hidden charges and idle capacity
Hidden charges account for a measurable share. Across those 84 deployments, data transfer, guardrails and provisioned throughput overflow contributed 18 to 34% overhead that the forecast never included.
Idle capacity supplies the rest. GPUs left running during debugging, meetings and overnight account for 30 to 50% of total spend. Reserving 80GB of VRAM for a model that peaks at 24GB wastes 70% of the allocation. One pattern bills 60 or more GPU-hours to deliver six GPU-hours of work.
A forecast built on provisioned capacity rather than used capacity inherits all of that, and it inherits it silently.
◆ FIVE NUMBERS INSTEAD OF ONE
A single annual figure cannot be corrected, only exceeded
What makes a forecast survive contact with a changing workload is stating the assumptions as variables rather than burying them in a total. Adoption rate, requests per user, tokens per request, context length, and price per token are five numbers. A forecast that names them can be re-run in an afternoon when one of them moves. A forecast that produces a single annual figure cannot be corrected, only exceeded.
Re-running matters more than getting it right initially. Three of the five inputs changed materially within 2026, so quarterly revision is the minimum cadence that tracks reality.
◆ FORECASTING A CHOICE, NOT A CONSTRAINT
Two cost paths differing by more than half
The optimisation side changes the arithmetic enough to be worth forecasting separately. On one measured deployment, FP8 quantization served 1.8 times the traffic on the same four-GPU footprint, and continuous batching lifted GPU utilization from 22% to 68%. Monthly GPU cost fell from about $29,200 to $14,951, and total monthly spend from roughly $39,100 to $16,151.
That is a 59% reduction from configuration, available without changing hardware or renegotiating anything. A forecast that assumes current configuration persists is forecasting a choice rather than a constraint. The same workload has two plausible cost paths that differ by more than half, and which one happens depends on work nobody scheduled. The levers are covered in three levers that beat new hardware.
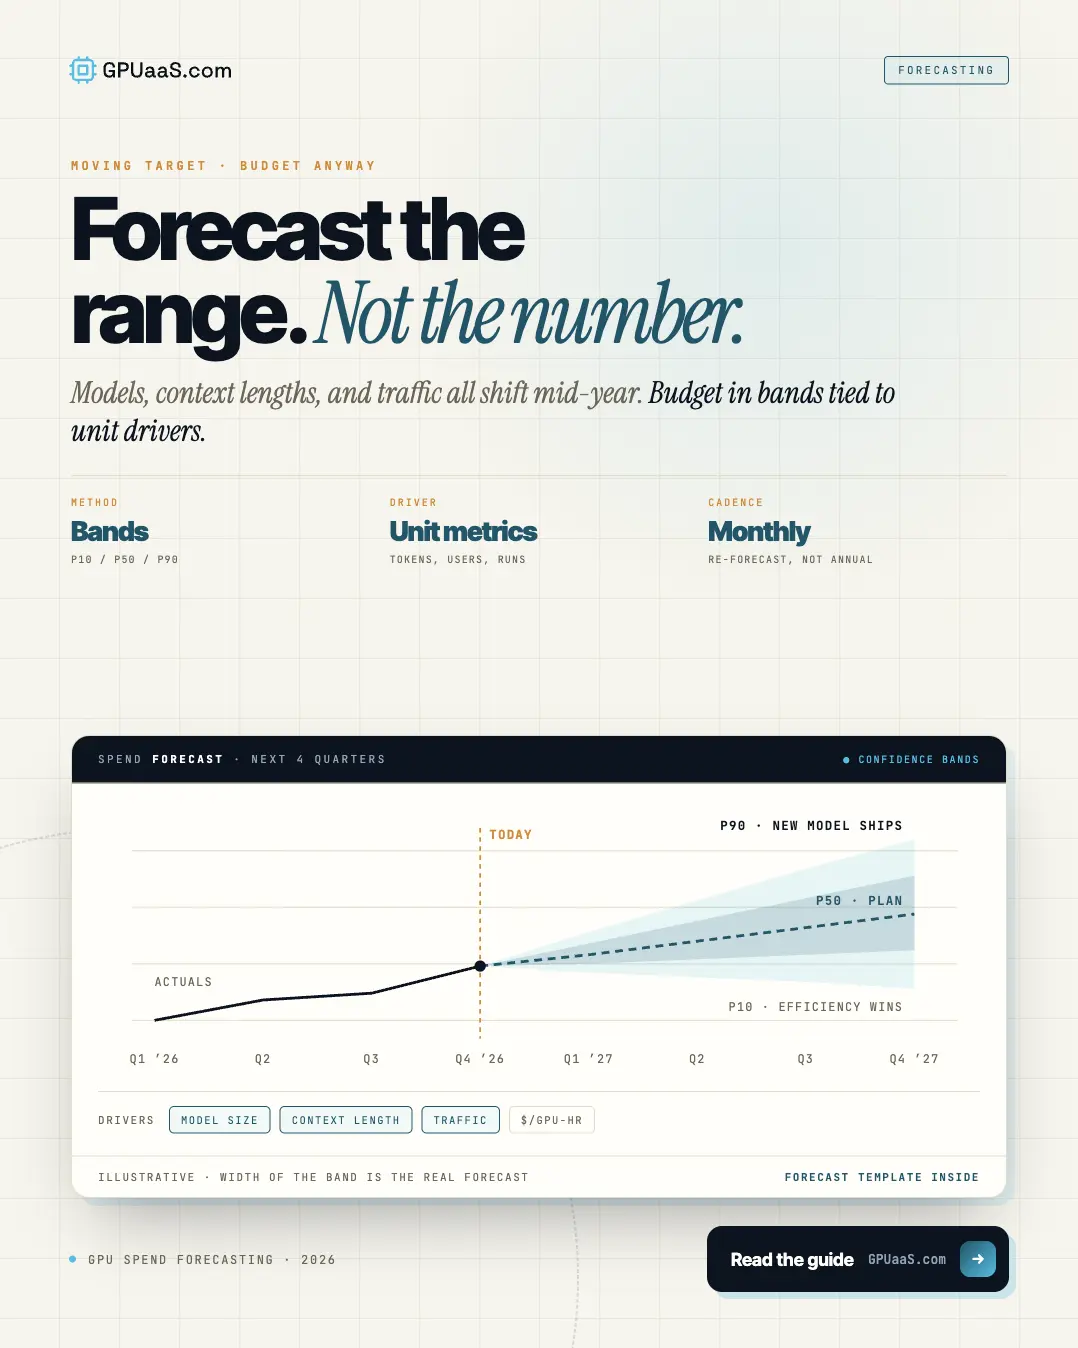
Forecast the range rather than the number. State the five inputs, re-run quarterly, and size the commitment against the lower bound rather than the midpoint, because capacity bought above actual demand is the one error that cannot be recovered later.
Size the commitment against the lower bound.
Short-term capacity for the range above it. No buyer fees. For single GPUs, packet.ai handles self-serve access with 24/7 human support.
Across 84 measured production deployments, the median bill ran 2.8 times the engineering forecast within the first 60 days. Only 15% of organisations forecast within 10% of actual, and 46.9% come in above plan against 5.6% below.
Because the inputs move in one direction. Context length grew from 4K to 50K tokens within a single forecast period, agentic workloads ran two to three times forecast volume, and hidden charges added 18 to 34% overhead. Falling token prices do not offset those because volume rises faster.
Quarterly at minimum. Three of the five key inputs changed materially during 2026, and annual budget approval against monthly spend growth is where overruns accumulate unnoticed.
Organisations budget 30 to 36% of cloud spend for AI while AI-specific line items appear at about 2.5% of bills. Consumption lands inside bills never labelled AI, from SaaS features, vector stores, provider keys and coding agents that no budget line anticipated.
Five stated variables rather than one total: adoption rate, requests per user, tokens per request, context length, and price per token. Named variables can be re-run when one moves. A single annual figure cannot be corrected, only exceeded.
Last reviewed: 23 September 2026. The 2.8x forecast multiplier and 18 to 34% hidden-charge overhead from OpsLyft's AI infrastructure benchmark across 84 anonymised AWS Bedrock production deployments, Q4 2025 to Q1 2026. Budget variance distribution from The Futurum Group's 2H 2026 CIO survey of 1,636 IT decision makers. Forecast accuracy and visibility figures from KPMG's Global AI Pulse Q2 2026 via PointFive, and CloudZero's ROI in the AI Era research. Token price movement and context window growth from the State of FinOps 2026 analysis via LLM CFO. Idle and VRAM overprovisioning figures from Lyceum Technology's GPU overprovisioning analysis. Optimisation deployment figures from Spheron's AI inference cost economics guide, 2026. Browse current GPU cluster availability on GPUaaS.com.