Blog ▸ The GPU Depreciation Schedule Your Finance Team Is Using Wrong
GPU Infrastructure
Used H100s trade at $18,000 to $22,000 against $25,000 to $35,000 new. The standard 30% salvage assumption looks low, and the gap swings TCO by $1.7 million.
The GPU Depreciation Schedule Your Finance Team Is Using Wrong
GPUaaS.com Team
GPU Infrastructure
September 24, 2026
No items found.
Depreciation schedules were argued about through 2025 and 2026 because nobody could check them.
A resale quote ends that argument. It supplies the number the schedule was estimating.
Key takeaways
Used H100s trade at $18,000 to $22,000 against $25,000 to $35,000 new, a functioning market with converging prices across several indices
The common 30-35% salvage assumption looks low. Observed H100 retention runs 75-85% at 18-24 months and toward 40-55% at 36
A 30% against 70% residual assumption at 36 months swings TCO by roughly $1.7 million on a 100-GPU cluster
Rental rates fell 75-80% from the 2023 peak while resale held near half of list. The asset holds value better than its earning power
A100 is the steeper curve, down to 30-50% of original list with another 10-15% expected
◆ WHAT THE SECONDARY MARKET ACTUALLY PAYS, MID-2026
GPU
New
Used
Trend
H100 80GB SXM
$25,000-$35,000
$18,000-$22,000
Stable
H100 PCIe 80GB
$25,000-$34,000
$14,000-$25,000
Stable
A100 80GB
Discontinued
$12,000-$18,000
Declining slowly
A100 40GB
Discontinued
$7,000-$10,000
Declining
Sources: GPUNex 2026 market pricing, ServerBuyback resale index July 2026, Mercatus secondary-market tracking across broker, OEM trade-in and auction channels
◆ THE MARKET IS REAL NOW
Thin through 2024, functional by 2026
Through 2024 the H100 secondary market was thin because the cards were too new. That changed as the fleets bought at scale in 2023 and 2024 reached the end of their premium service life at roughly the same time. By July 2026 a dedicated marketplace for used, refurbished and surplus accelerators was operating alongside reserved-capacity venues.
Prices across independent indices now converge rather than scatter. One resale index lists used H100 PCIe 80GB at $14,000 to $25,000 against $25,000 to $34,000 new. A separate listing page shows $16,000 to $20,000. Refurbished SXM cards trade at $18,000 to $22,000. An eight-GPU H100 server changes hands around $150,000 to $180,000 against roughly $500,000 for a new B300 system.
Sticker price was never the real price. Used and refurbished H100s traded as high as $50,000 during the mid-2024 scarcity peak while retail held at $25,000 to $40,000, then fell sharply as supply normalised.
◆ THE ASSUMPTION THAT LOOKS WRONG
Salvage set too low, not too high
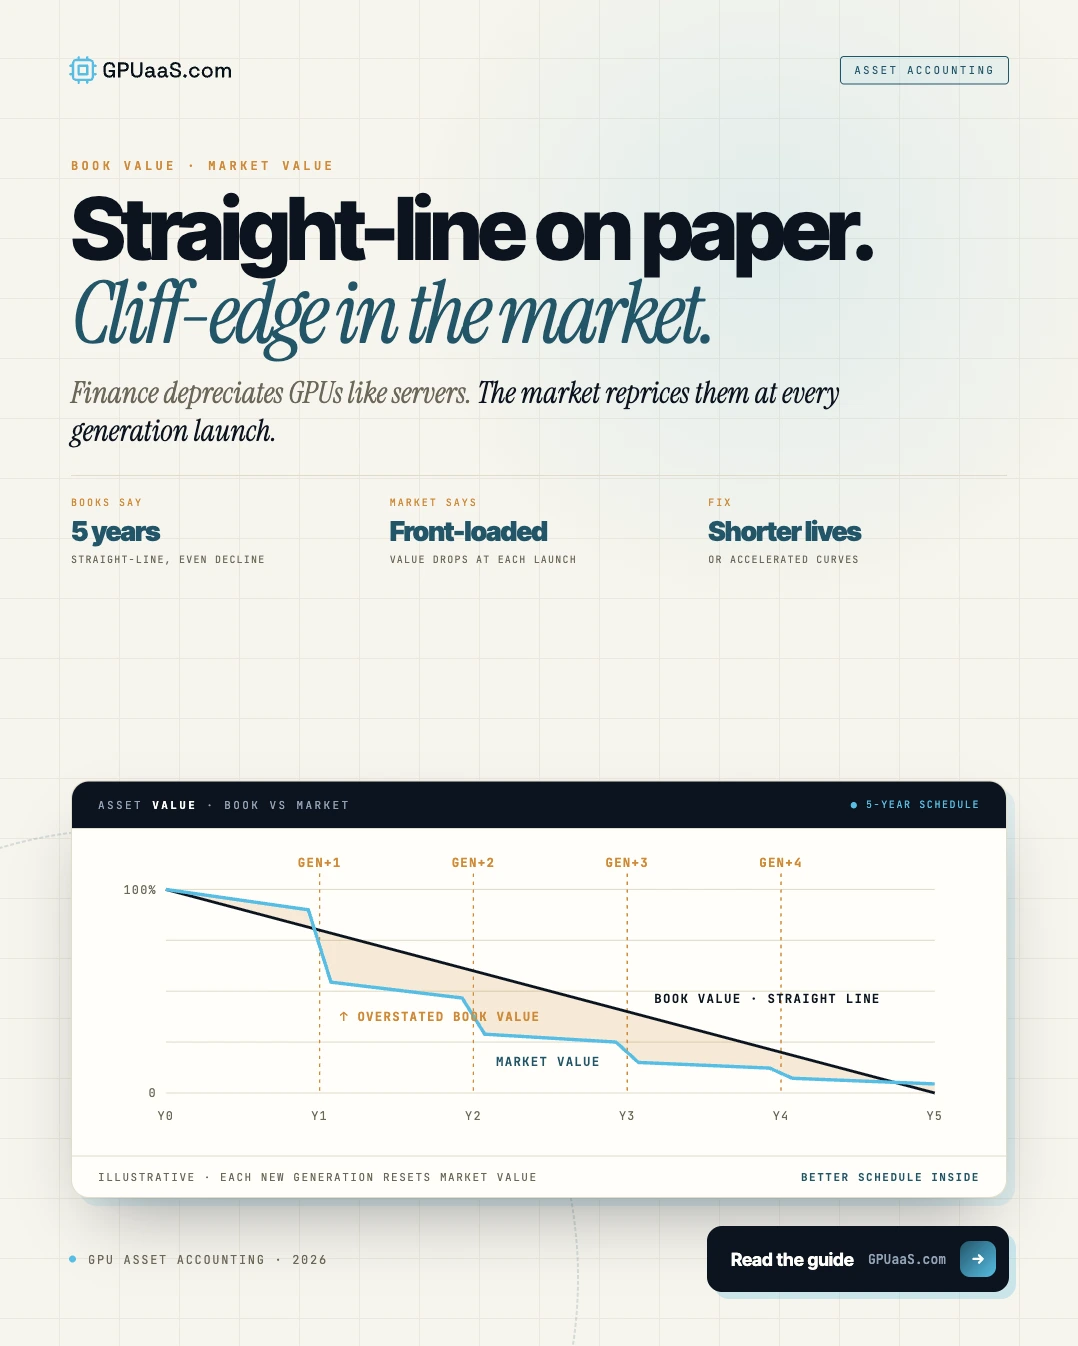
Standard accounting practice puts GPU salvage value around 30 to 35%. Observed H100 retention runs 95 to 100% in the first twelve months, 75 to 85% at 18 to 24 months, and toward 40 to 55% at 36 depending on how fast Blackwell displaces it.
At the 36-month mark a schedule assuming 30% salvage against a market paying 55% is overstating depreciation expense by a quarter of the asset's original value. That makes owned infrastructure look worse than it is, which is the opposite of the direction the depreciation debate usually runs.
The point is not that one number is right. It is that the number is now checkable, and most schedules were set before it was.
$1.7 million
the swing in three-year total cost of ownership on a 100-GPU cluster between a 30% and a 70% residual assumption, from one line in a model
Mercatus H100 depreciation analysis, 2026
◆ WHAT THE ASSUMPTION MOVES
$1.08 against $1.52 per GPU-hour
Residual feeds straight into the depreciation component of effective hourly cost. On a modelled H100 deployment, the residual assumption alone moves the depreciation line from $1.08 to $1.52 per GPU-hour, a 40% range on a number that gets quoted as though it were fixed.
At system level the arithmetic is similar. An eight-GPU HGX H100 server runs about $285,000 integrated. At mid-case 55% card retention, estimated three-year resale lands near $115,000, leaving $170,000 of net depreciation. Across the plausible resale range, effective cost moves between $1.35 and $1.92 per GPU-hour at 70% utilization.
Buyers who plan the exit own capacity materially cheaper than buyers who assume scrap value. The difference is not operational skill. It is one input.
◆ TWO CURVES THAT DIVERGE
The asset holds value better than its earning power
H100 marketplace rental rates have fallen 75 to 80% from the 2023 peak, moving from $7 to $10 an hour at launch down to $2 to $4. Over the same period resale value held near half of original list.
Those two curves do not track each other, and the gap matters for anyone deciding whether to keep running a fleet or sell it. An asset whose hourly earning power fell 78% while its sale value fell 45% is telling you that the resale channel has become the better exit than the rental one, at least on this generation.
◆ A100 IS THE STEEPER CURVE
Where the schedule and the market agree
The A100 launched in 2020. By 2024 it had lost 50 to 60% of original value, and by 2026 it trades at 30 to 50% of original list with a further 10 to 15% decline expected as more fleets move to Blackwell.
That curve is close to what a conservative schedule would have predicted, which is worth noting precisely because the H100 curve is not. Generation and displacement speed matter more than age, and a single depreciation policy applied across both parts will be wrong on at least one of them.
◆ TIMING THE EXIT
Depreciation follows the architecture cycle, not the calendar
GPU value steps down on a roughly two-year architecture cycle rather than declining smoothly, so selling ahead of the next generation launch captures materially more than selling after it. That creates a pattern worth planning for: pre-emptive disposal at peak residual rather than disposal when the hardware stops being useful.
Against that, renting out idle capacity can generate two to four times more total revenue than a single sale over an 18 to 24 month window. For H100 that comparison still favours holding and renting. For A100 it is close to even, because the steeper depreciation erodes what holding is worth.
The practical move is to replace the salvage assumption in the model with a current resale quote, then re-run. The schedule was an estimate made when no market existed to check it against. One now does, and the gap between the two numbers is usually larger than anything else in the model.
Refurbished SXM cards trade at $18,000 to $22,000 against $25,000 to $35,000 new. PCIe 80GB units run $14,000 to $25,000 on one resale index and $16,000 to $20,000 on another. An eight-GPU H100 server changes hands around $150,000 to $180,000.
For H100 it looks low. Observed retention runs 75 to 85% at 18 to 24 months and toward 40 to 55% at 36. A schedule assuming 30% against a market paying 55% overstates depreciation by a quarter of original value, making owned infrastructure look worse than it is.
A 30% against 70% residual at 36 months swings three-year TCO by roughly $1.7 million on a 100-GPU cluster. At the hourly level it moves the depreciation line from $1.08 to $1.52 per GPU-hour, a 40% range from a single input.
Displacement speed rather than age. A100 launched in 2020 and now trades at 30 to 50% of original list with a further 10 to 15% decline expected. H100 has held better because demand for Hopper-specific workloads persisted. A single policy across both parts will be wrong on one.
Renting idle capacity can generate two to four times more total revenue than a single sale over 18 to 24 months, which still favours holding H100. For A100 the comparison is close to even, because steeper depreciation erodes the value of holding. Value also steps down on the architecture cycle, so selling ahead of a generation launch captures more than selling after.
Last reviewed: 25 September 2026. Used pricing from GPUNex 2026 market data, ServerBuyback's July 2026 resale index and Compute Exchange listings, compiled in Servnet UK's GPU residual value study, August 2026. Depreciation curves, TCO sensitivity and per-GPU-hour figures from Mercatus H100 depreciation and resale tracking across broker, OEM trade-in and auction channels, 2026. Secondary market development and A100 pricing from Hashrate Index's used GPU market analysis. Marketplace quotes, rental rate decline and server-level pricing from Aethir's GPU resale value analysis, October 2026. Rent-versus-sell comparison from GPUNex. Browse current GPU cluster availability on GPUaaS.com.