Blog ▸ Serving 100 vs 10,000 Concurrent Users: How Cost Per Token Scales
GPU Infrastructure
Effective cost per million output tokens spans $0.21 to $15.25 on identical H100 hardware. The difference is load, not hardware.
Serving 100 vs 10,000 Concurrent Users: How Cost Per Token Scales
GPUaaS.com Team
GPU Infrastructure
September 15, 2026
No items found.
On identical H100 hardware, effective cost per million output tokens spans $0.21 to $15.25.
The difference is load, not hardware.
Key takeaways
Effective cost per million output tokens spans $0.21 to $15.25 on the same H100 hardware, driven by load rather than configuration
The underutilization penalty runs 2.5 to 24x at enterprise loads and reaches 36.3x near idle
Public cost calculators assume fixed utilization. That assumption is the dominant source of error, larger than model or GPU choice
Reserved capacity is worst at low concurrency and best at high, and it plateaus at 390 req/min where on-demand scales to 748
Prefix caching at 50% hit rate cuts TTFT 78% and raises throughput 254% at the same time, removing the usual tradeoff
◆ THE PENALTY IS STRUCTURAL
Not specific to one GPU family
The measured underutilization penalty runs 2.5 to 24 times across enterprise loads of one to ten requests per second. At one request per second it reaches 36.3 times. Across configurations at that load it spans 17.5x on Mixtral 8x7B at FP16 to 36.3x on Qwen3-30B-A3B at FP8.
The same sweep was repeated on A100 80GB PCIe, which has no native FP8 and uses Gen4 PCIe rather than NVLink. The pattern held. This is structural, not specific to one GPU family.
◆ WHAT EVERY COST CALCULATOR GETS WRONG
Utilization treated as an input, never measured
Public LLM cost calculators treat GPU utilization as a fixed input. Entered by the user, baked in as a preset, or silently assumed at 100%. None measure it against actual load. That assumption is the dominant source of error in infrastructure cost estimates, larger than model choice or GPU selection.
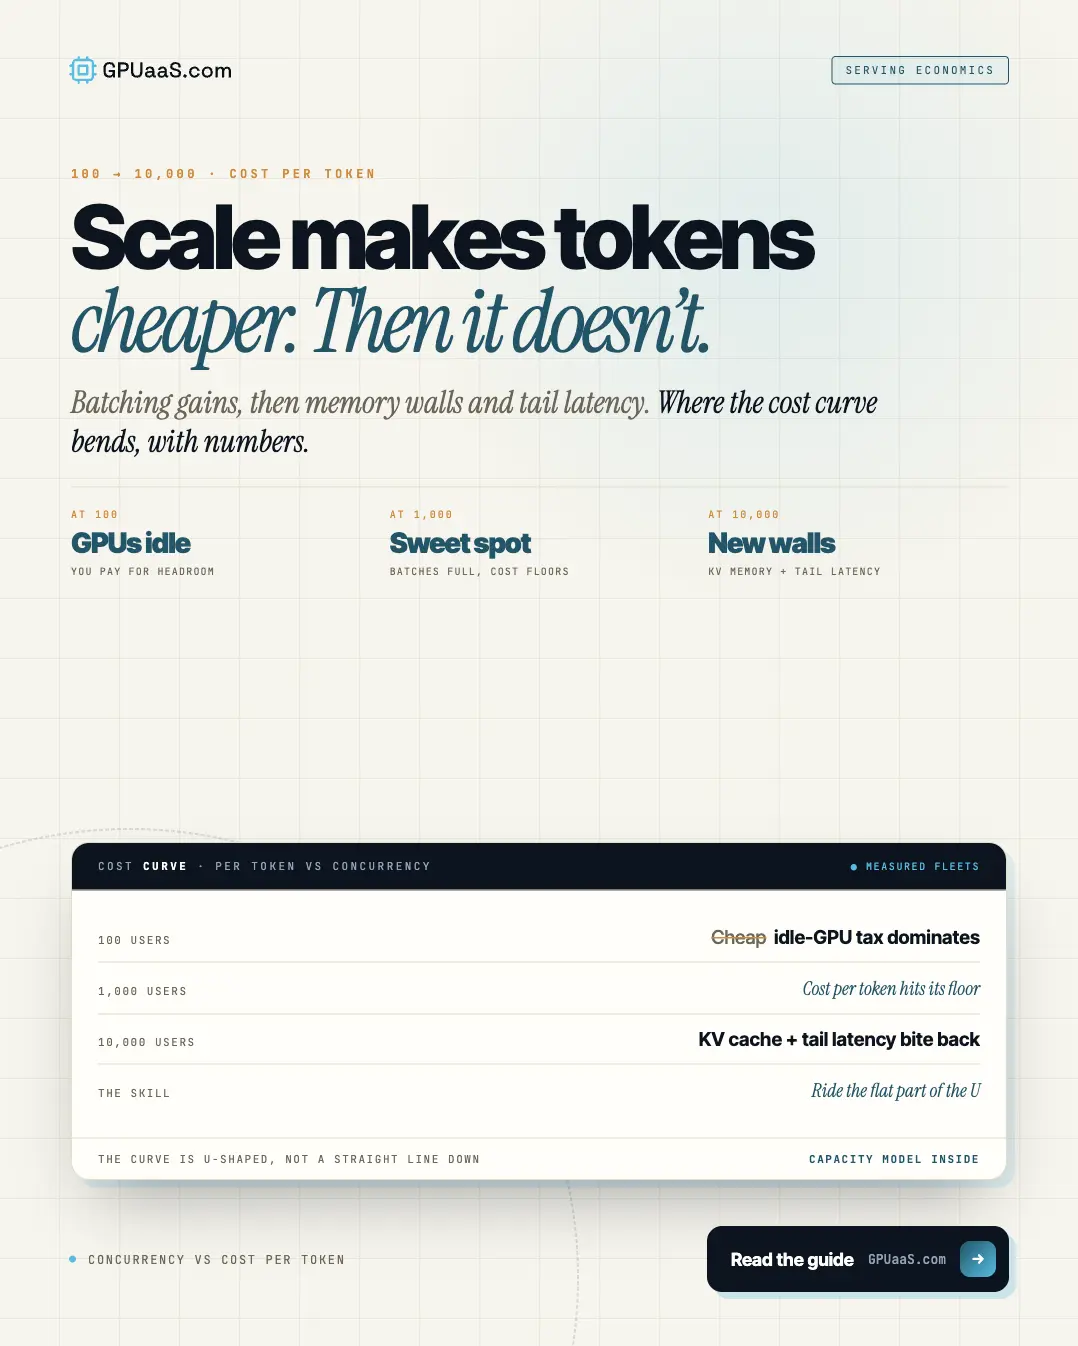
Cost per token falls as concurrency rises. The fixed hourly cost of the GPU spreads across more work. A team serving 100 concurrent users and a team serving 10,000 on the same hardware are running different cost structures, not the same one at different volumes.
$0.21 to $15.25
effective cost per million output tokens on identical H100 hardware, a 72-fold range determined by offered load rather than by any hardware or model difference
Beyond Per-Token Pricing, concurrency-aware LLM infrastructure cost methodology, June 2026
◆ WHY LOW CONCURRENCY IS EXPENSIVE
The hourly rate bills anyway
Decode is memory-bound. It achieves only 30 to 80% of the bandwidth ceiling even when saturated, and at low arrival rates it sits well below that. The hourly rate bills anyway. At high concurrency batches fill, the GPU stays busy, and per-token cost approaches the floor set by hardware and model.
◆ COST EFFICIENCY BY CONCURRENCY, RESERVED VS ON-DEMAND
Concurrent users
Reserved (conc per cent)
On-demand standard
1
0.02
0.17
5
0.11
0.21
10
0.23
0.25
20
0.46
0.33
50
1.14
0.40
Concurrent users supported per cent of spend per minute. Crossover sits between 10 and 20 concurrent. Source: Latency and Cost of Multi-Agent Intelligent Tutoring at Scale, 2026
◆ RESERVED CAPACITY INVERTS
Worst at low concurrency, best at high, with a ceiling
Reserved capacity inverts on the same logic. Provisioned capacity delivers 0.02 concurrent users per cent of spend at one concurrent user. At 50 concurrent it reaches 1.14, as the fixed monthly rate spreads across real load. Pay-as-you-go at standard priority runs 0.17 to 0.40 across the same range, billing only for what is used.
Reserved capacity also has a ceiling. In the same measurements it plateaued near 390 requests per minute while on-demand priority scaled to 748 at 50 concurrent. The plateau matched a latency crossover at the same load point. Both point to one saturation event. Capacity sized for average load stops scaling at peak.
◆ SOME OF THE COST IS POLICY
Latency budget nothing consumes
Serving systems enforce latency targets uniformly across traffic that does not uniformly need them. Under default schedulers, decode steps overshoot their time-per-output-token target by roughly a thousand tokens of headroom. Prefill falls behind its time-to-first-token target at the same time. Agent and batch workloads pay for latency budget nothing consumes, because the same SLA applies to them as to a human waiting on a chat response.
Separating traffic classes is available before any hardware change.
◆ WHERE THE TRADEOFF DISAPPEARS
TTFT down 78%, throughput up 254%, at once
Prefix caching removes the latency-throughput tradeoff rather than trading between them. At a 50% shared-prefix hit rate, time to first token falls 78% and throughput rises 254%. Both at once. The system is skipping work it would otherwise repeat. Any deployment with a shared system prompt has that hit rate available.
Hardware scales predictably once utilization is high. At 1,024 concurrent requests, B200 measured 9,870 output tokens per second against 6,694 on H200, about 47% higher. Data parallelism scales close to linearly. One GPU at 1,000 tokens per second becomes four at 4,000, without the inter-GPU communication overhead tensor parallelism adds on batch workloads.
◆ THE SPREAD IS NOT THE SAME AS THE AVERAGE
Tail latency moves even when cost does not
Near saturation, throughput and cost reproduce reliably run to run. Tail latency does not. Operators holding a time-to-first-token target close to saturation should plan for run-to-run spread at the percent level on the tail, even where the cost figures are stable.
That matters for how a concurrency target gets set. Sizing to the point where cost per token bottoms out puts the deployment exactly where tail latency becomes least predictable. The cheapest operating point and the most reliable one are not the same point, and the gap between them is a deliberate choice rather than a rounding error.
◆ THE NUMBER MOST QUOTES NEVER ASK FOR
Concurrency beats hardware choice on cost per token
The concurrency number matters more than the hardware choice for cost per token. Most quotes never ask for it. A quote built on assumed 100% utilization can be off by more than an order of magnitude at real enterprise load.
Measure requests per second at peak and at median. Size against both. Price the gap deliberately rather than finding it on an invoice.
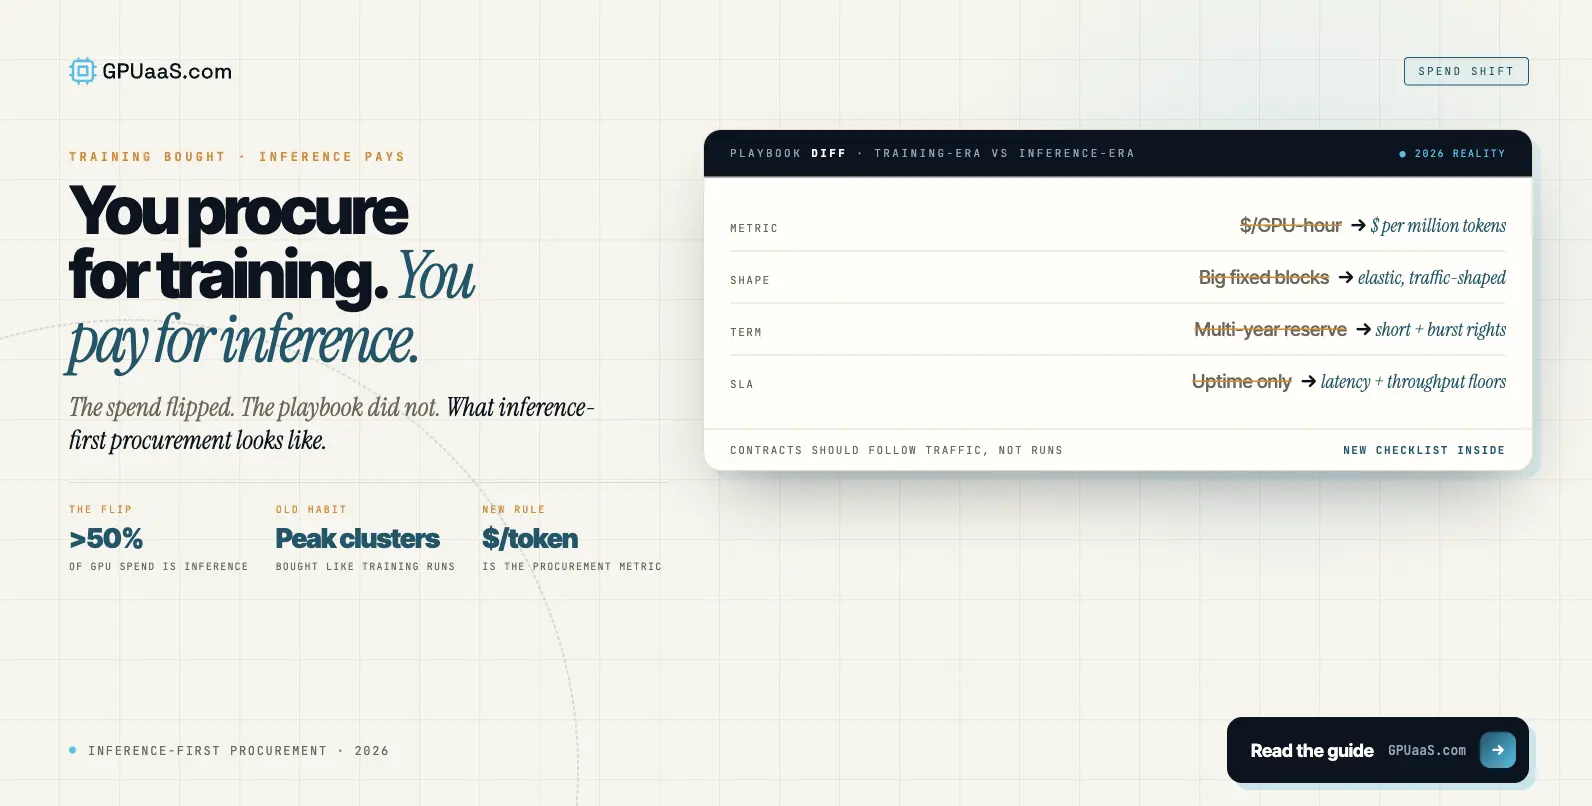
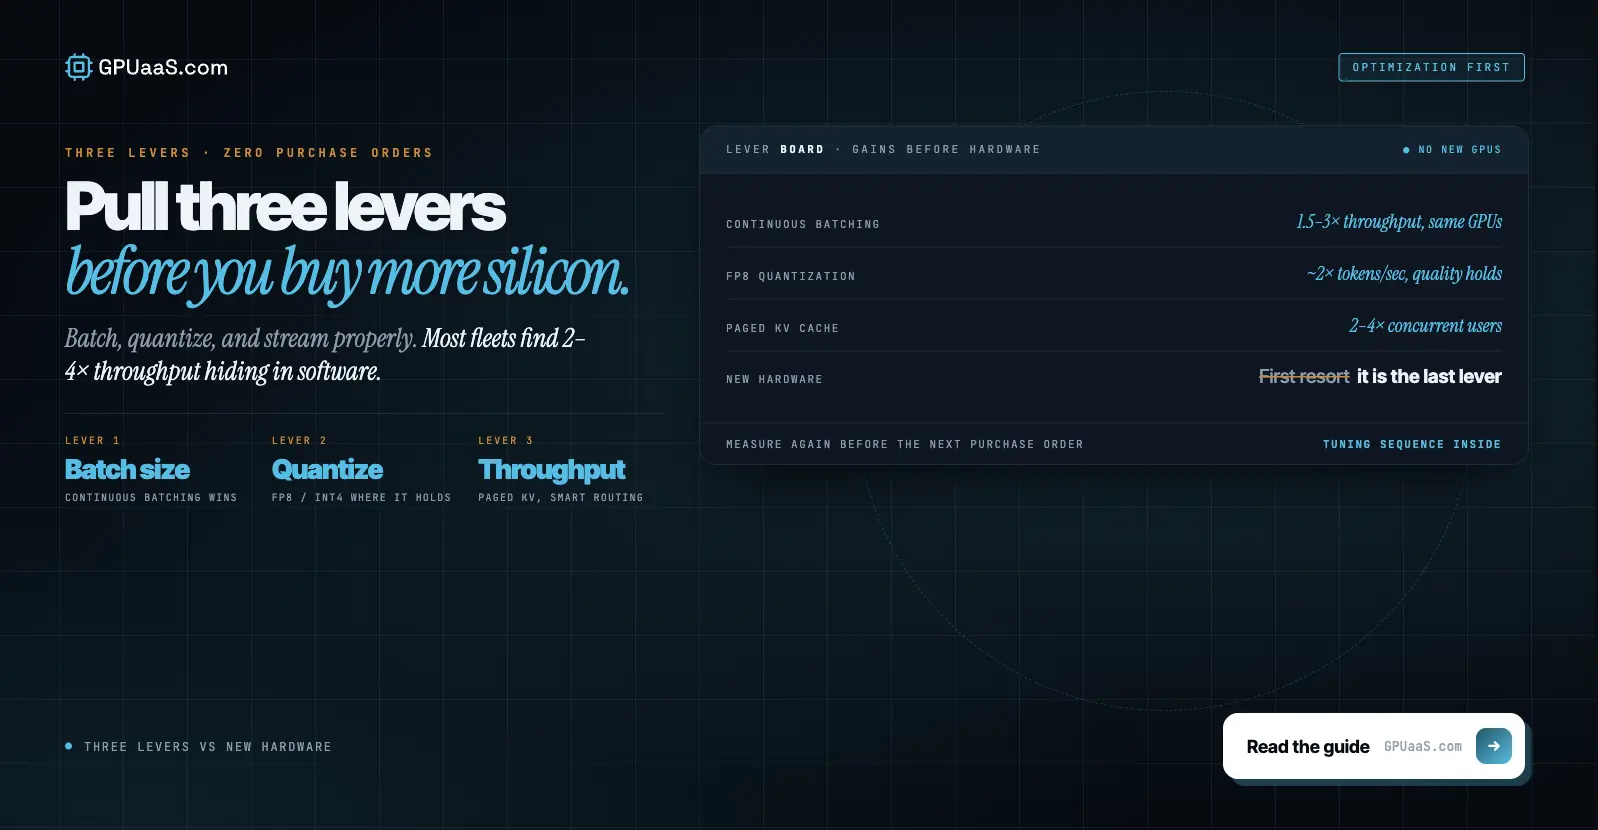
Low concurrency is expensive per token and no configuration makes it cheap. What changes is whether that idle time is paid on a reserved contract sized for peak, or on demand where only running capacity bills. For the software levers that raise effective throughput before any of this, see three levers that beat new hardware.
Get quoted against measured load.
Not assumed utilization. No buyer fees. For single GPUs, packet.ai handles self-serve access with 24/7 human support.
Down, steeply. The fixed hourly cost of the GPU spreads across more work as concurrency rises. On identical H100 hardware, effective cost spans $0.21 to $15.25 per million output tokens depending on offered load, with the underutilization penalty reaching 36.3 times near idle.
Because they treat GPU utilization as a fixed input rather than measuring it against real load. It gets entered by the user, preset, or silently assumed at 100%. That single assumption produces more error than model choice or GPU selection.
Between 10 and 20 concurrent users in the measured data. Below that, reserved capacity is paying for idle silicon at 0.02 concurrent per cent of spend. Above it, the fixed rate spreads across real load and reaches 1.14 at 50 concurrent, well ahead of on-demand.
Prefix caching. At a 50% shared-prefix hit rate, time to first token falls 78% while throughput rises 254% simultaneously, because the system skips work it would otherwise repeat rather than trading one metric against the other. Any deployment with a shared system prompt has that available.
Requests per second at peak and at median, not just a GPU count. Concurrency affects cost per token more than hardware choice does, and a quote built on assumed 100% utilization can be off by more than an order of magnitude at real enterprise load.
Last reviewed: 16 September 2026. Cost range, underutilization penalties, and the A100 replication sweep from Beyond Per-Token Pricing, a concurrency-aware methodology for LLM infrastructure cost estimation, June 2026. Reserved versus on-demand cost efficiency and throughput plateau data from Latency and Cost of Multi-Agent Intelligent Tutoring at Scale, 2026. Scheduler headroom and prefix caching figures from Human-less LLM Serving, May 2026. B200 and H200 concurrency throughput from Metrum AI benchmarks via Lyceum Technology, August 2026. Decode bandwidth ceiling and data parallel scaling from DigitalOcean's LLM inference trilemma analysis. Browse current GPU cluster availability on GPUaaS.com.