Blog ▸ Multi-Node Training at 512 GPUs and Above: What Changes
GPU Infrastructure
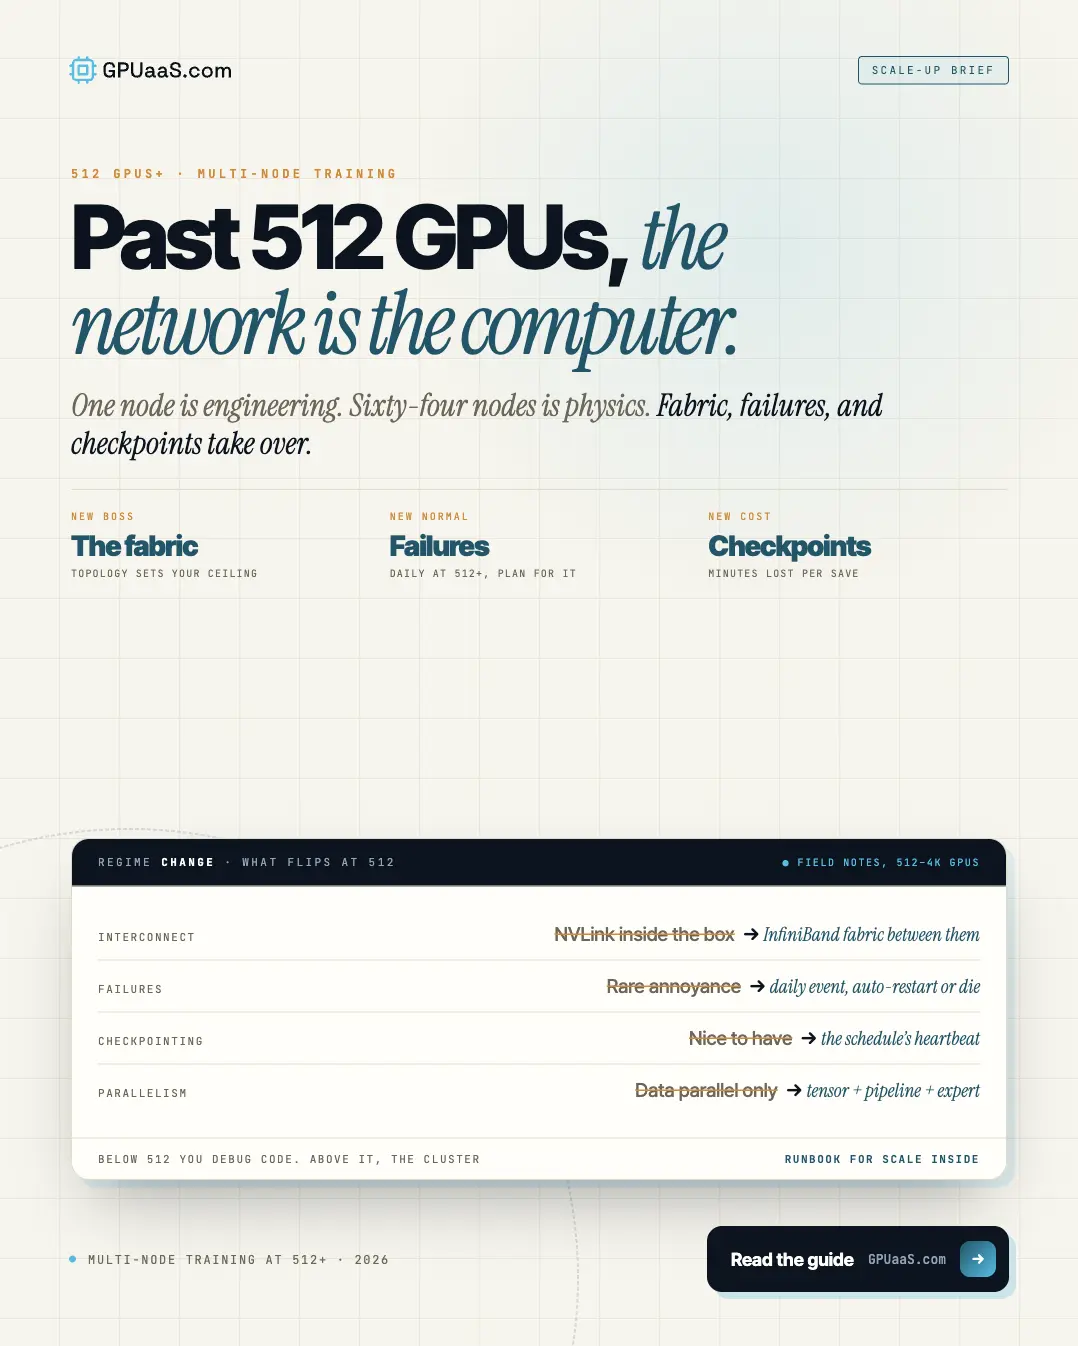
A 1.5% per-node daily failure rate becomes 84.8% at 1,000 GPUs. Above 512 GPUs the binding constraint stops being throughput and becomes reliability.
Multi-Node Training at 512 GPUs and Above: What Changes
GPUaaS.com Team
GPU Infrastructure
September 8, 2026
No items found.
A single node failing 1.5% of days sounds survivable. That was Alibaba's measured rate.
Scale it to 1,000 GPUs and the daily failure rate for the job becomes 84.8%.
Key takeaways
Above 512 GPUs the binding constraint stops being throughput and becomes reliability. A 16,000-GPU cluster has an MTBF of three hours
Problems appear at production scale that cannot be reproduced in a 2-4 node test. A pilot validates the code, not the deployment
Stragglers hit 59% of jobs at 512-1,024 GPUs with a 34.59% average completion delay, and the cause is workload imbalance rather than hardware faults
Even with 30-minute checkpoints and zero checkpoint overhead, a 3-hour MTBF produces a 19% MFU loss
Tensor parallelism stays inside the node. Pipeline or data parallelism crosses node boundaries. Getting this backwards is the most expensive mistake at scale
◆ THE MULTIPLICATION IS THE WHOLE STORY
Nothing got less reliable. There is just more of it.
That multiplication is the whole story of training above 512 GPUs. Individual GPUs have a mean time between failures around 80,000 hours, roughly nine years. A 16,000-GPU cluster has an MTBF of three hours. Nothing got less reliable. There is just more of it, and distributed training relies on tightly coupled workers using MPI-style collectives that are not fault tolerant, so when any one worker dies the entire job restarts from a checkpoint.
At this scale the binding constraint stops being throughput and becomes reliability.
◆ WHAT SCALE DOES TO FAILURE RATES
Scale
Observed reliability
Single GPU
~80,000 hour MTBF, roughly 9 years
Single node
1.5% daily failure rate (Alibaba measured)
1,000 GPUs
84.8% daily failure rate for the job
4,000 GPUs
MTTF around 10 hours
16,000 GPUs
MTBF around 3 hours
Sources: Alibaba cluster data via Efficient Training of LLMs on Distributed Infrastructures survey, Meta RSC reliability analysis, FFTrainer failover research
◆ FINDING ONE
A pilot on four nodes validates the code, not the deployment
The most useful public data on this comes from a 63-node B200 cluster running 504 GPUs, analysed across 55 days of Prometheus time series and 73 days of operational logs covering 224 multi-node training sessions. Five organisations shared the monitoring pipeline.
That cluster hit a storage I/O bottleneck that emerged only at 60-node scale and was entirely absent in two-to-four-node pre-tests. No single team could isolate it alone. This is the part most teams get wrong: a pilot on four nodes validates the code, not the deployment. Behaviour at 512 GPUs is not an extrapolation of behaviour at 32.
◆ FINDING TWO
Failures concentrate rather than distribute
Across 224 sessions, the top 3 of 63 nodes accounted for more than half of all node exclusions. That changes the operational response entirely. Chasing a cluster-wide reliability problem is the wrong move when a handful of nodes are producing most of the incidents, and identifying them requires per-node exclusion tracking that most setups do not collect by default.
Detection also has to be multi-signal. Across 751 Prometheus metrics and 10 XID-identified GPU failures, no metric was consistently dominant across failure types. A dashboard watching temperature and utilisation will miss most of what actually takes a job down.
1.5% → 84.8%
a single node's daily failure rate scaled to a 1,000-GPU job, because synchronous training fails entirely when any one worker does
Alibaba cluster data via Efficient Training of LLMs on Distributed Infrastructures survey
◆ STRAGGLERS GET LESS ATTENTION AND COST MORE
The slowest worker sets the pace for all of them
In clusters above 10,000 GPUs, 59% of training jobs at the 512 to 1,024 GPU range experienced fail-slow stragglers, with an average job completion delay of 34.59%. A separate study found 42.5% of production jobs affected, wasting 10.4% of total GPU hours.
The cause is the interesting part. The dominant sources were workload-level imbalances, pipeline-stage skew and garbage collection pauses, rather than hardware faults. A node that is slightly slow does not trigger any alarm. It just holds up every synchronisation point, and in synchronous training the slowest worker sets the pace for all of them. Without per-iteration throughput logging, operators typically notice only by comparing speeds across sessions after the fact.
That logging is a configuration change to the training framework, made before the run starts. It is close to free and it is the difference between finding a straggler in an hour and finding it in a week.
◆ CHECKPOINTING IS WHERE THE ARITHMETIC TURNS UNFORGIVING
93.1% of checkpoint write time is queue wait
Even with checkpoints every 30 minutes and zero checkpoint overhead, a three-hour mean time between failures produces a 19% MFU loss. That is the floor, before any real checkpoint cost is counted.
The real cost is I/O queueing, and the measured numbers are worse than most teams assume. On that 504-GPU cluster, checkpoint writes spent 1.89 seconds of a 2.03-second average request time sitting in queue. That is 93.1% queue wait. Reads during restore spent 54.2 milliseconds of 78.2, or 57%. The storage layer, not the write itself, is the bottleneck.
This is why the parallel file system is a first-order decision at this scale rather than an infrastructure detail. WekaIO, Lustre, and BeeGFS get chosen for checkpoint and dataset I/O behaviour under concurrent load from hundreds of nodes, which is a different sizing exercise from capacity.
◆ AUTOMATED RECOVERY PAYS FOR ITSELF
33% sounds unimpressive until you compare it
Across 12 auto-retry chains covering 73 attempts, chain success rate was 33.3%, about 2.7 times higher than manual recovery. Median retry interval was 11 minutes with a tight interquartile range of 10 to 11. Median downtime was 1.9 hours against 3.3 hours for manual intervention.
A 33% success rate sounds unimpressive until you notice it is nearly triple the manual rate and it happens without waking anyone up.
◆ TOPOLOGY ABOVE A SINGLE NODE
Tensor parallel stays inside the node
Parallelism topology changes shape above a single node, and the rule is simple. Tensor parallelism stays inside the node, because it demands the highest bandwidth and lowest latency. Pipeline or data parallelism crosses node boundaries, because they tolerate latency better. Getting this backwards, running tensor parallel across nodes, is the most expensive configuration mistake available at this scale. The underlying mechanism is covered in why 8 GPUs is not 8x one GPU.
For models above 70B, Megatron-Core provides the three parallelism modes and sits underneath NeMo. On the DeepSpeed side, ZeRO-3's overhead comes from reconstructing parameter shards on every forward and backward pass, which is why prefetching the next shard while computing on the current one matters so much. Turning that off should be a debugging step, not a default.
The procurement consequence is that a quote for 512 GPUs and a quote for 32 are not the same product. At 32, you are buying throughput. At 512, you are buying the provider's ability to detect a fail-slow node, restart a job automatically, and sustain checkpoint I/O from 60 nodes at once. Those are operational capabilities, and they are worth asking about explicitly, because the rate card does not mention them.
Often enough to plan around. A 1.5% daily per-node failure rate scales to 84.8% daily at 1,000 GPUs. At 4,000 GPUs, MTTF runs around 10 hours. At 16,000, MTBF is roughly three hours. Individual GPUs are reliable; there are simply many of them and synchronous training fails entirely when one worker does.
Only partially. A small pilot validates the code, not the deployment. One documented production cluster hit a storage I/O bottleneck that appeared only at 60-node scale and was entirely absent from two-to-four-node pre-tests. Behaviour at 512 GPUs is not an extrapolation of behaviour at 32.
A node running slightly slow rather than failing outright. It triggers no alarm but holds up every synchronisation point, and in synchronous training the slowest worker sets the pace. These affected 59% of jobs at 512-1,024 GPUs with an average 34.59% completion delay, mostly from workload imbalance rather than hardware faults.
More than the write time suggests. Even with 30-minute checkpoints and zero overhead, a three-hour MTBF costs 19% of MFU. On a measured 504-GPU cluster, checkpoint writes spent 93.1% of their request time queued rather than writing, which makes the parallel file system a first-order decision rather than an infrastructure detail.
Tensor parallelism stays inside the node, since it demands the highest bandwidth and lowest latency. Pipeline or data parallelism crosses node boundaries, since they tolerate latency better. Running tensor parallel across nodes is the most expensive configuration mistake available at this scale.
Last reviewed: 9 September 2026. Production cluster findings from Lablup's operational analysis of LLM pre-training on 504 GPUs, a 63-node NVIDIA B200 cluster studied across 55 days of Prometheus data and 73 days of logs covering 224 sessions, June 2026. Failure rate scaling from Alibaba cluster data via Efficient Training of Large Language Models on Distributed Infrastructures. MTTF projections from Meta's research cluster reliability analysis. Checkpoint MFU loss figures from FFTrainer fast failover research. Parallelism configuration guidance from Spheron's distributed LLM training multi-node setup guide, April 2026. Browse current GPU cluster availability on GPUaaS.com.