Blog ▸ Why Your GPU Utilization Says 100% and Throughput Is Low
GPU Infrastructure
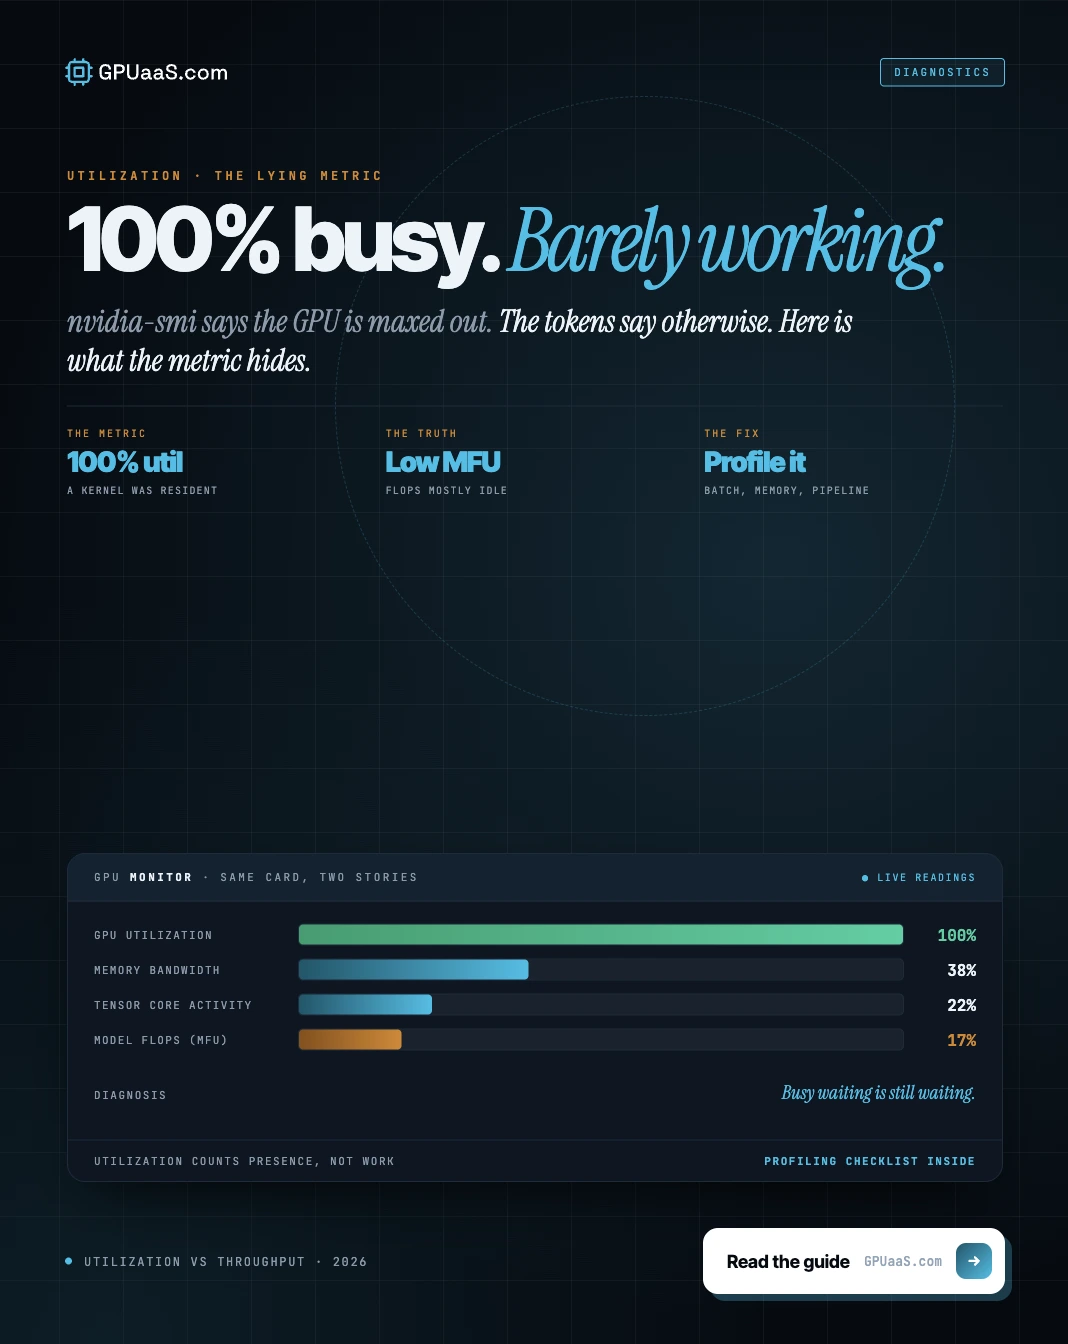
nvidia-smi GPU-Util reports whether a kernel was running, not whether useful work happened. One kernel on 1 of 132 SMs reads 100%. What to measure before signing a capacity expansion.
Why Your GPU Utilization Says 100% and Throughput Is Low
GPUaaS.com Team
GPU Infrastructure
September 2, 2026
No items found.
A team running a 24-GPU H100 inference fleet graphed one GPU metric on their main dashboard. It sat at 95 to 100% around the clock. The standing assumption was that they were GPU-bound and needed more capacity. A $1.2 million expansion was drafted.
Before it was signed, someone added profiling metrics.
Key takeaways
nvidia-smi GPU-Util measures whether any kernel was running, not whether useful work happened. One tiny kernel on 1 of an H100's 132 SMs reads 100%
This is the normal state of LLM inference. Autoregressive decode saturates the metric at 100% while SMs run around 15%
Most LLM training lands at 35 to 45% MFU, including frontier-scale runs. A fleet at 100% utilization and 40% MFU is not broken
Add SM efficiency to the dashboard. DCGM ships it by default and it is a configuration change rather than a capital expense
On MIG, GPU-level monitoring is actively wrong rather than imprecise. Per-instance DCGM metrics are required for cost attribution to work at all
◆ WHAT THE METRIC ACTUALLY MEASURES
A time-based occupancy flag, not a work measurement
The metric on that dashboard was utilization.gpu from nvidia-smi, exposed as DCGM_FI_DEV_GPU_UTIL in the DCGM exporter. NVIDIA's own definition: the percent of time over the past sample period during which one or more kernels was executing on the GPU.
Read that again. It is a time-based occupancy flag. It is not a work measurement.
If a single tiny kernel runs on one of an H100's 132 streaming multiprocessors for the entire sampling window, that metric reads 100%. The other 131 SMs sit idle. The dashboard says fully utilized. The silicon is mostly asleep.
◆ THE DEMONSTRATION IS TRIVIAL
One thread, one SM, 100% reported
Launch a kernel that does nothing but loop forever, on one thread, on one SM. nvidia-smi reports 100% utilization. NVIDIA's own forum confirms the behaviour: it returns 100% if there is any work in the compute engine, including a kernel with a single thread. In the most extreme version, you can hit 100% by reading and writing memory while performing zero floating point operations.
This is not an exotic edge case. It is the normal state of LLM inference.
Autoregressive decode launches a stream of small kernels, one per token. Each barely touches the GPU's compute capacity, and each keeps a kernel resident for the duration. GPU utilization saturates at 100% while the SMs run at around 15%. The workload is memory-bandwidth-bound, the compute units are idle most of the time, and the dashboard cannot tell the difference.
1 of 132
streaming multiprocessors busy on an H100 is enough for nvidia-smi to report 100% utilization, with the other 131 idle
NVIDIA developer forum and DevOpsBeast DCGM observability analysis, 2026
◆ WHAT EACH METRIC ACTUALLY TELLS YOU
Metric
What it answers
Where to get it
GPU-Util
Was any kernel running? Nothing more
nvidia-smi, DCGM (default)
SM efficiency
What share of the 132 SMs were active
DCGM (ships by default)
Achieved occupancy
How full each SM's warp capacity was
PyTorch Profiler, Nsight Compute
MFU
What fraction of peak compute was achieved
Calculated per run
Power draw
Corroborating only, not a work measure
nvidia-smi, DCGM
◆ A FLEET AT 100% AND 40% MFU IS NORMAL
The gap between the two is where the decision lives
Most LLM training runs land at 35 to 45% Model FLOP Utilization. Even frontier-scale runs sit in that band rather than near the ceiling. So a fleet reporting 100% utilization while achieving 40% MFU is not broken. It is normal, and the gap between those two numbers is where the capacity decision actually lives.
Three metrics close the gap, and DCGM ships the first one by default.
SM efficiency, sometimes called SM activity, measures the percentage of active SMs over an interval. An H100 has 132 SMs, each managing 128 cores, 16,896 in total. Low SM efficiency alongside high reported utilization usually means kernels are poorly parallelized or memory-bound. This is the single most useful addition to a dashboard that currently shows only utilization.
Achieved occupancy goes a level deeper: the ratio of active warps to the maximum an SM can hold. A kernel at 100% utilization with 25% occupancy is leaving three quarters of the SM's warp capacity unused. PyTorch Profiler reports this, and Nsight Compute gives per-kernel detail.
MFU is the one to use for procurement decisions specifically. It measures the fraction of theoretical peak compute a run actually achieves, accounting for memory bandwidth, network latency, and software overhead. It is not something to monitor continuously layer by layer, but it is the number that answers whether more GPUs will help.
◆ TWO SECONDARY TRAPS
Memory reporting and power draw
Memory reporting misleads in the opposite direction. PyTorch and TensorFlow pre-allocate GPU memory, so nvidia-smi shows high memory usage even when very little is actively in use. A fleet that looks memory-constrained may not be.
Power draw is corroborating evidence rather than a work measurement. A GPU can pull close to its power limit doing low-value work, and a memory-bound workload can be the binding bottleneck while drawing only moderate power.
◆ ON MIG IT IS ACTIVELY WRONG
Not imprecise, wrong
MIG deserves its own warning, because there GPU-level monitoring is not merely imprecise but actively wrong. nvidia-smi reports at the physical GPU level while workloads run inside MIG instances. DCGM exposes per-instance metrics with GPU_I_ID and GPU_I_PROFILE labels, which is what lets you see that one instance is at 80% tensor-active while the instance beside it is idle. Without those, multi-tenant MIG is a black box and per-tenant cost attribution, the main reason to run MIG at all, becomes impossible.
◆ THE TWO PROBLEMS COMPOUND
Idle much of the time, inefficient when busy
There is a broader pattern here that compounds rather than cancels. Industry measurement puts average enterprise GPU utilization at around 5% across 23,000 production clusters, meaning fleets sit unused most of the time. Separately, only about 7% of teams achieve above 85% utilization. And when a fleet does run, the utilization figure overstates how much useful work is happening. Both problems are real and they stack: idle much of the time, and inefficient when busy.
The procurement consequence is the $1.2 million one. Utilization at 100% is a smoke alarm, not a fuel gauge. It confirms the GPU is busy. It says nothing about whether the GPU is busy with the work you are paying for, and it cannot distinguish a saturated fleet that genuinely needs expansion from an inefficient one that needs a kernel rewrite. Signing a capacity expansion off that number alone means the expansion might buy nothing.
Add SM efficiency to the dashboard before adding GPUs to the fleet. It is a configuration change rather than a capital expense, and it is the difference between knowing the fleet is busy and knowing it is productive. For why more GPUs deliver less than proportional throughput even when they are needed, see why 8 GPUs is not 8x one GPU.
Get quoted against measured throughput.
Not a dashboard reading. No buyer fees. For single GPUs, packet.ai handles self-serve access with 24/7 human support.
Because nvidia-smi GPU-Util reports whether any kernel was executing during the sample period, not how much work was done. A single kernel on one of an H100's 132 SMs reads 100% while the other 131 sit idle. In LLM inference this is the normal state, since autoregressive decode keeps small kernels resident while SMs run around 15%.
SM efficiency, which DCGM ships by default and which measures what share of the SMs were actually active. Add achieved occupancy from PyTorch Profiler for per-kernel depth, and calculate MFU for any capacity decision. Utilization is still useful for answering whether a machine is idle.
Most LLM training runs land at 35 to 45%, and even frontier-scale runs sit in that band rather than near the ceiling. A fleet reporting 100% utilization while achieving 40% MFU is not broken, it is typical. The gap between the two numbers is what a capacity decision should be based on.
Not reliably. PyTorch and TensorFlow pre-allocate GPU memory, so nvidia-smi reports high usage even when very little is actively in use. A fleet that looks memory-constrained on that reading may have substantial headroom.
nvidia-smi reports at the physical GPU level while workloads run inside MIG instances, which makes top-line numbers actively wrong rather than merely imprecise. DCGM per-instance metrics using GPU_I_ID and GPU_I_PROFILE labels are required, otherwise per-tenant cost attribution is impossible.
Last reviewed: 3 September 2026. Metric definitions and the fleet expansion case from DevOpsBeast's DCGM and Prometheus GPU observability analysis, May 2026. SM efficiency and MFU guidance from Trainy's GPU utilization analysis and Amnic's GPU utilization guide, June 2026. Monitoring stack detail from Spheron's GPU monitoring for ML guide, January 2026. Single-thread kernel behaviour confirmed on the NVIDIA developer forum. Occupancy definitions from NVIDIA Nsight Compute documentation. Browse current GPU cluster availability on GPUaaS.com.